Better Cloud Unit Economics with a New Business Metrics Provider
We are thrilled to announce that we have added a new provider for our budget metrics feature, which is a key component of our FinOps platform. Budget metrics allow you to measure and optimize your cloud spending based on your business activity.
But why is this important? Because it helps you understand and improve your cloud unit economics, which is one of the most important concepts in FinOps. Cloud unit economics is a system of profit maximization based on objective measurements of how well your organization is performing against not only its FinOps goals, but as a business overall.
With our budget metrics feature, you can easily calculate your cloud unit costs for any metric that matters to your business, such as revenue, users, transactions, or seats. This way, you can identify opportunities to reduce waste, increase efficiency, and optimize performance.
Our new provider makes it even easier to integrate your budget metrics with any usage data found in your cloud provider billing information. You can also customize your dashboards and reports to suit your needs and preferences.
We hope you enjoy our new provider and we look forward to hearing your feedback.
Cloud usage data as business metrics
It’s normal that your cloud spends are going to increase over time but it should match your company’s overall business trend. This is not to say that you are not going to do regular optimizations like rightsizing or workload management to decrease your cloud provider bill but here we are looking at a longer term.
Here’s an example of usage information found in the cloud billing data that can be leveraged as a proxy of the business activity.
In the Teevity Dynamic Cost Explorer you can build a report of your egress traffic. This report is going to be used as a proxy of the business trend, a pulse if you want.
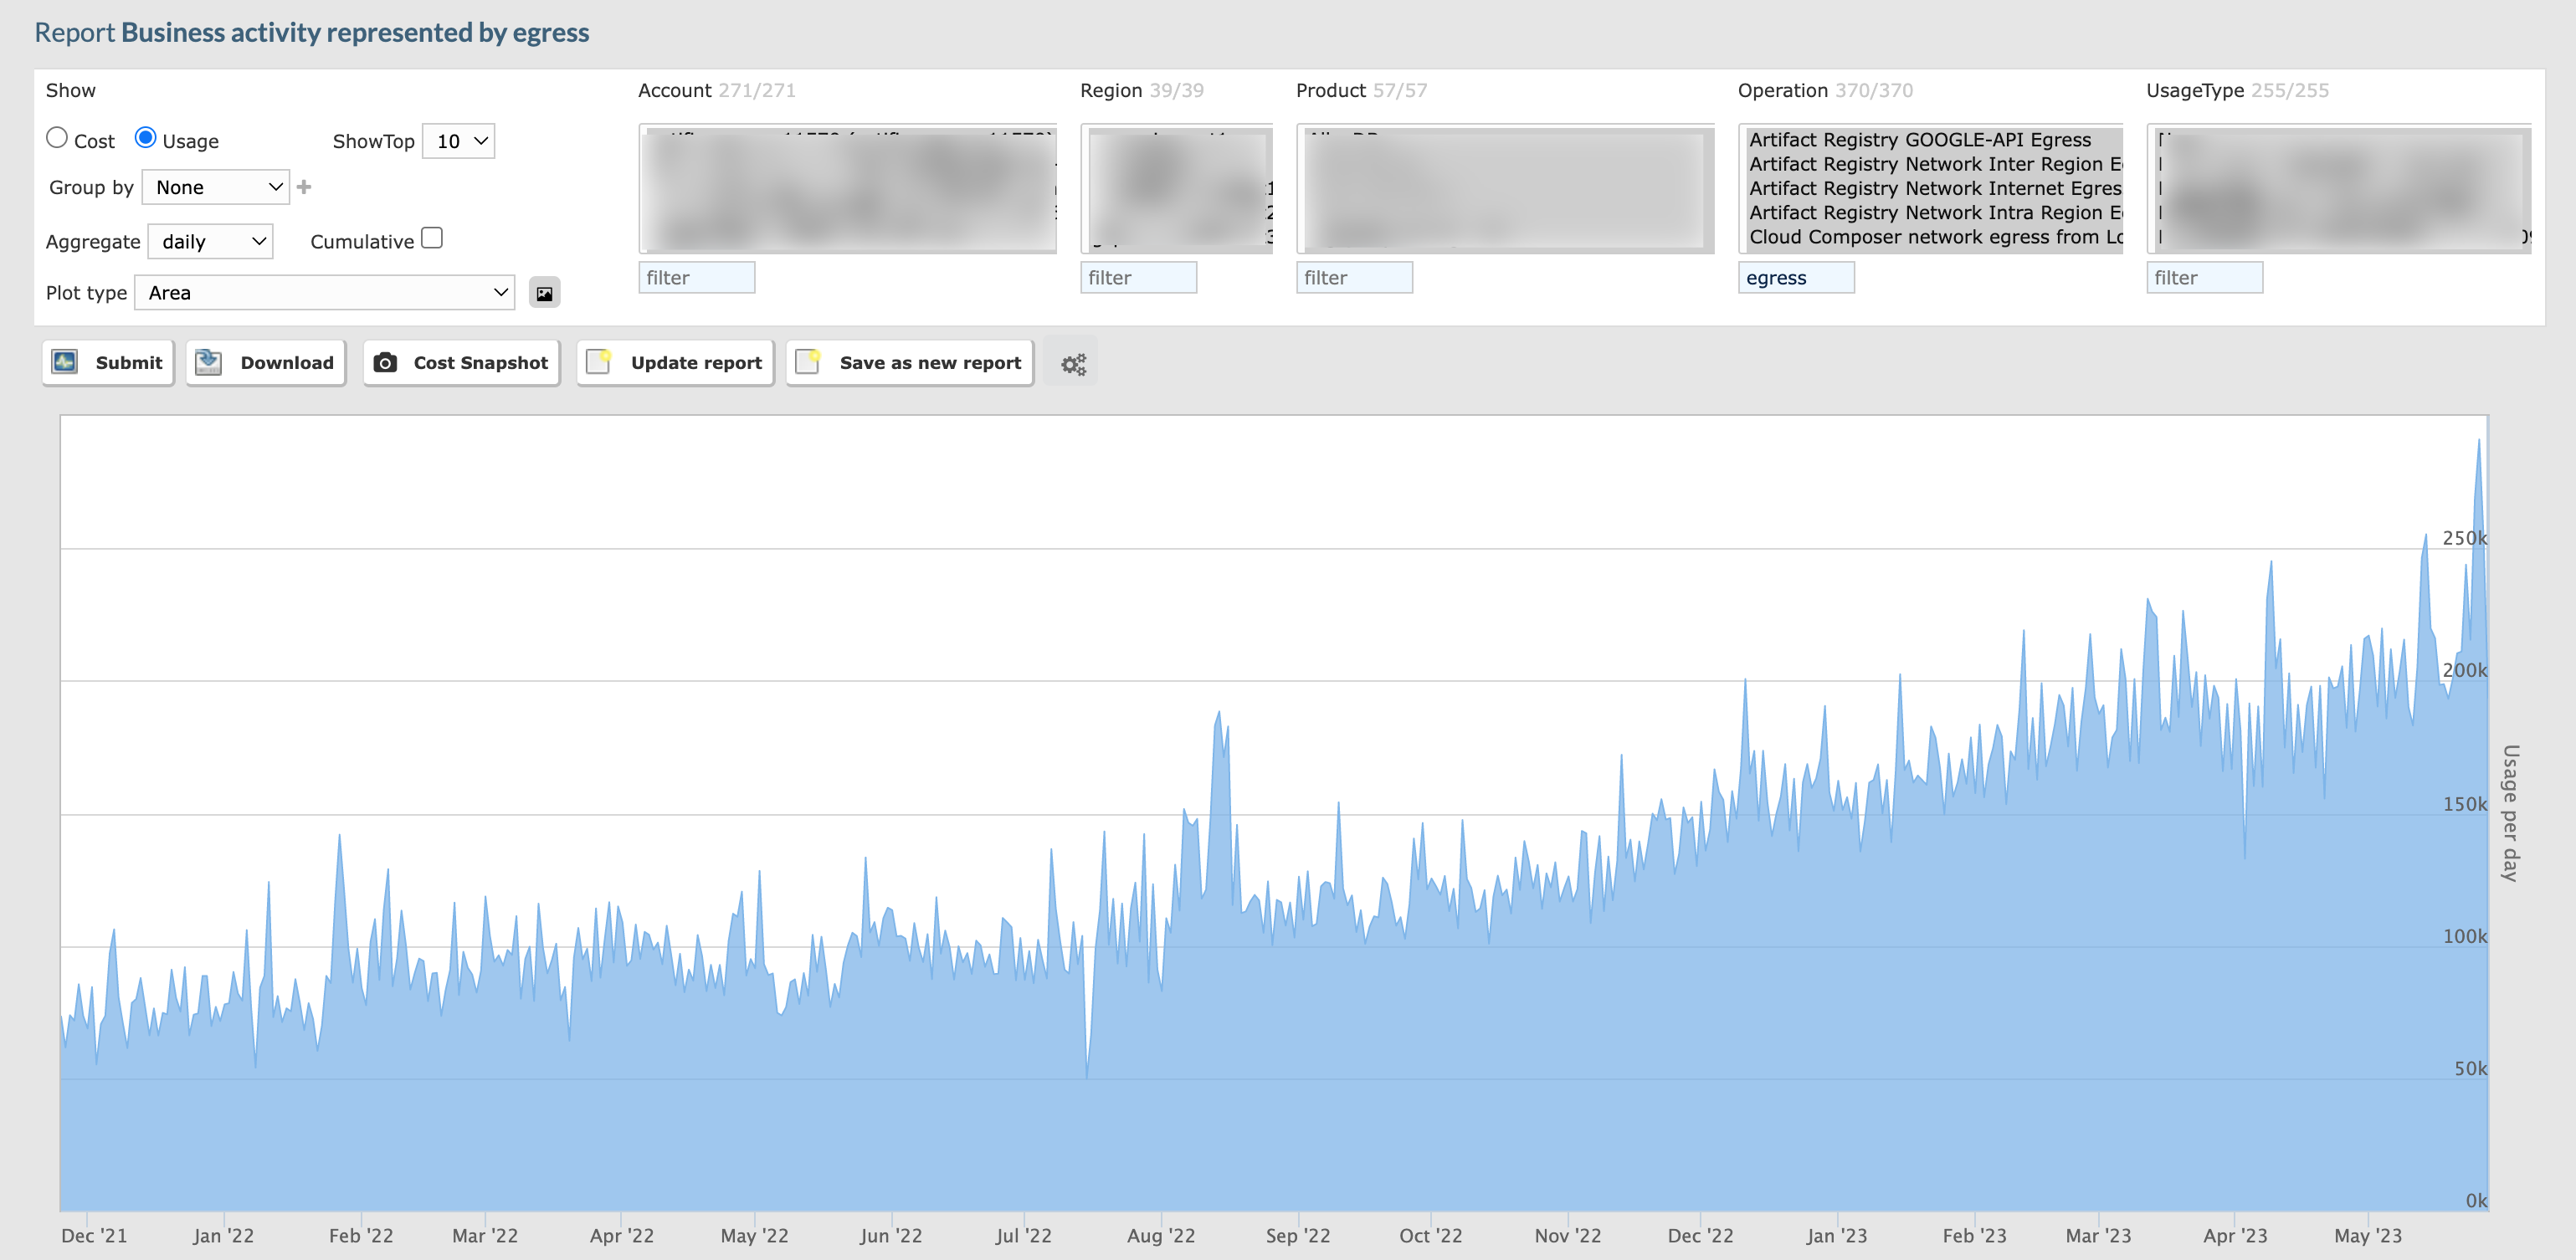 Egress traffic as a proxy of business activity
After configuring this report as the source of business data as described in our documentation, you can use it in your cloud cost exploration.
The chart at the top is the absolute cloud spend by product. Below is the same information but relative to the business unit trend.
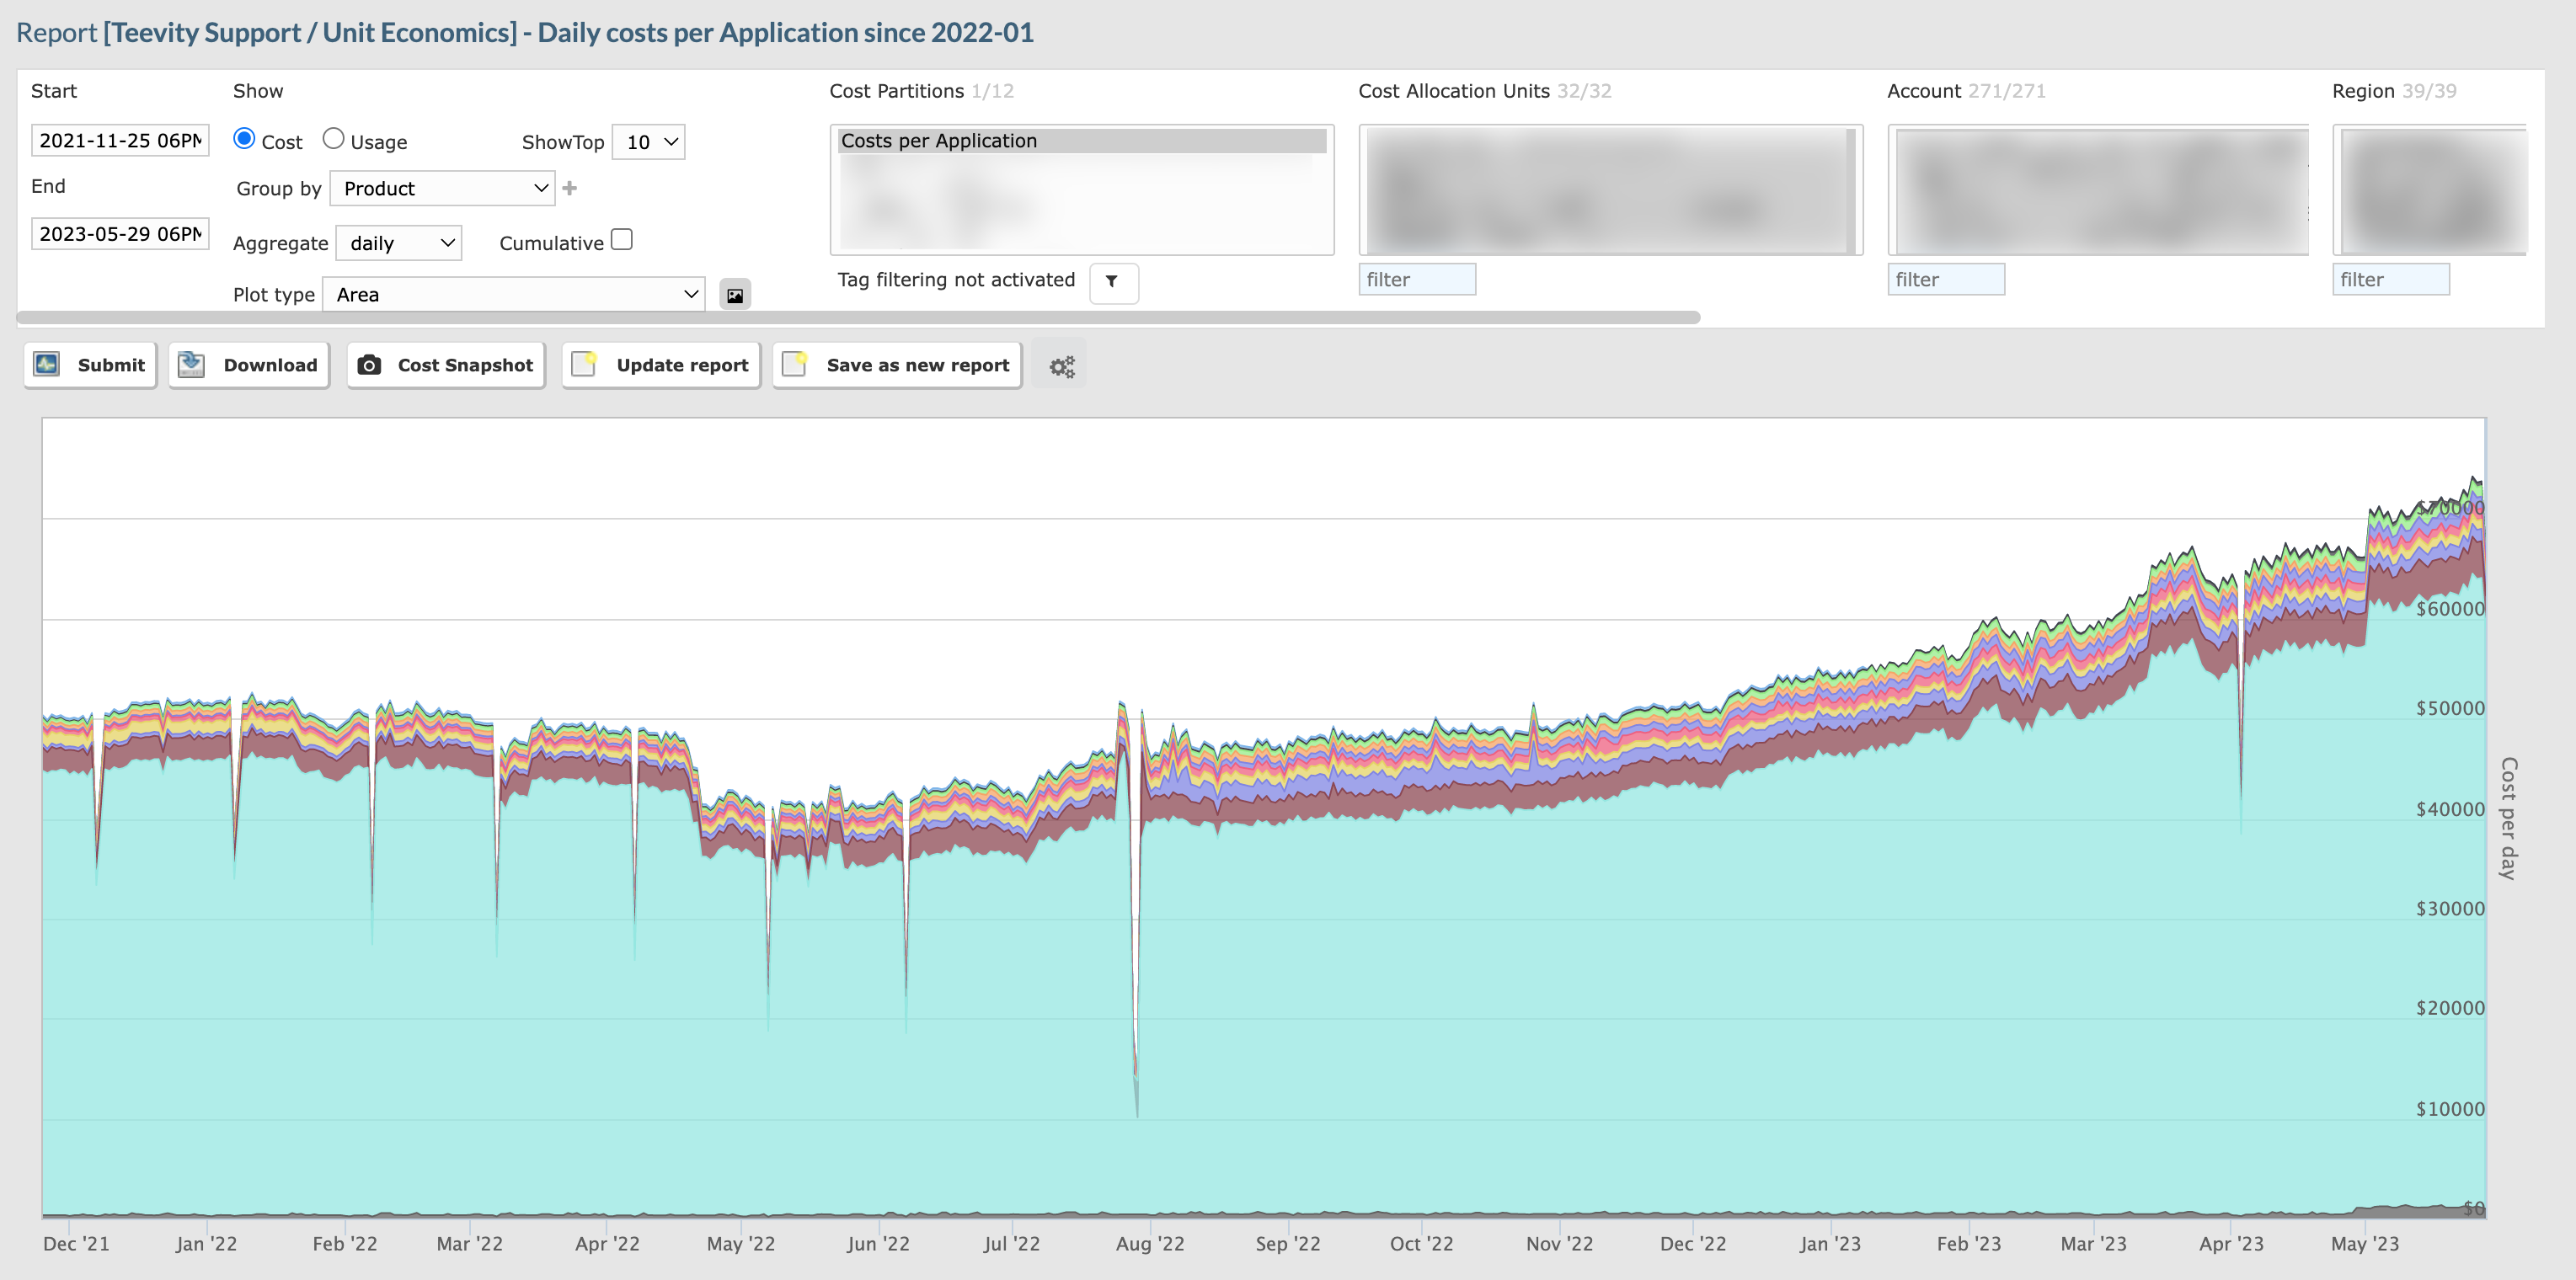 Cloud spending without business context i.e. in absolute terms
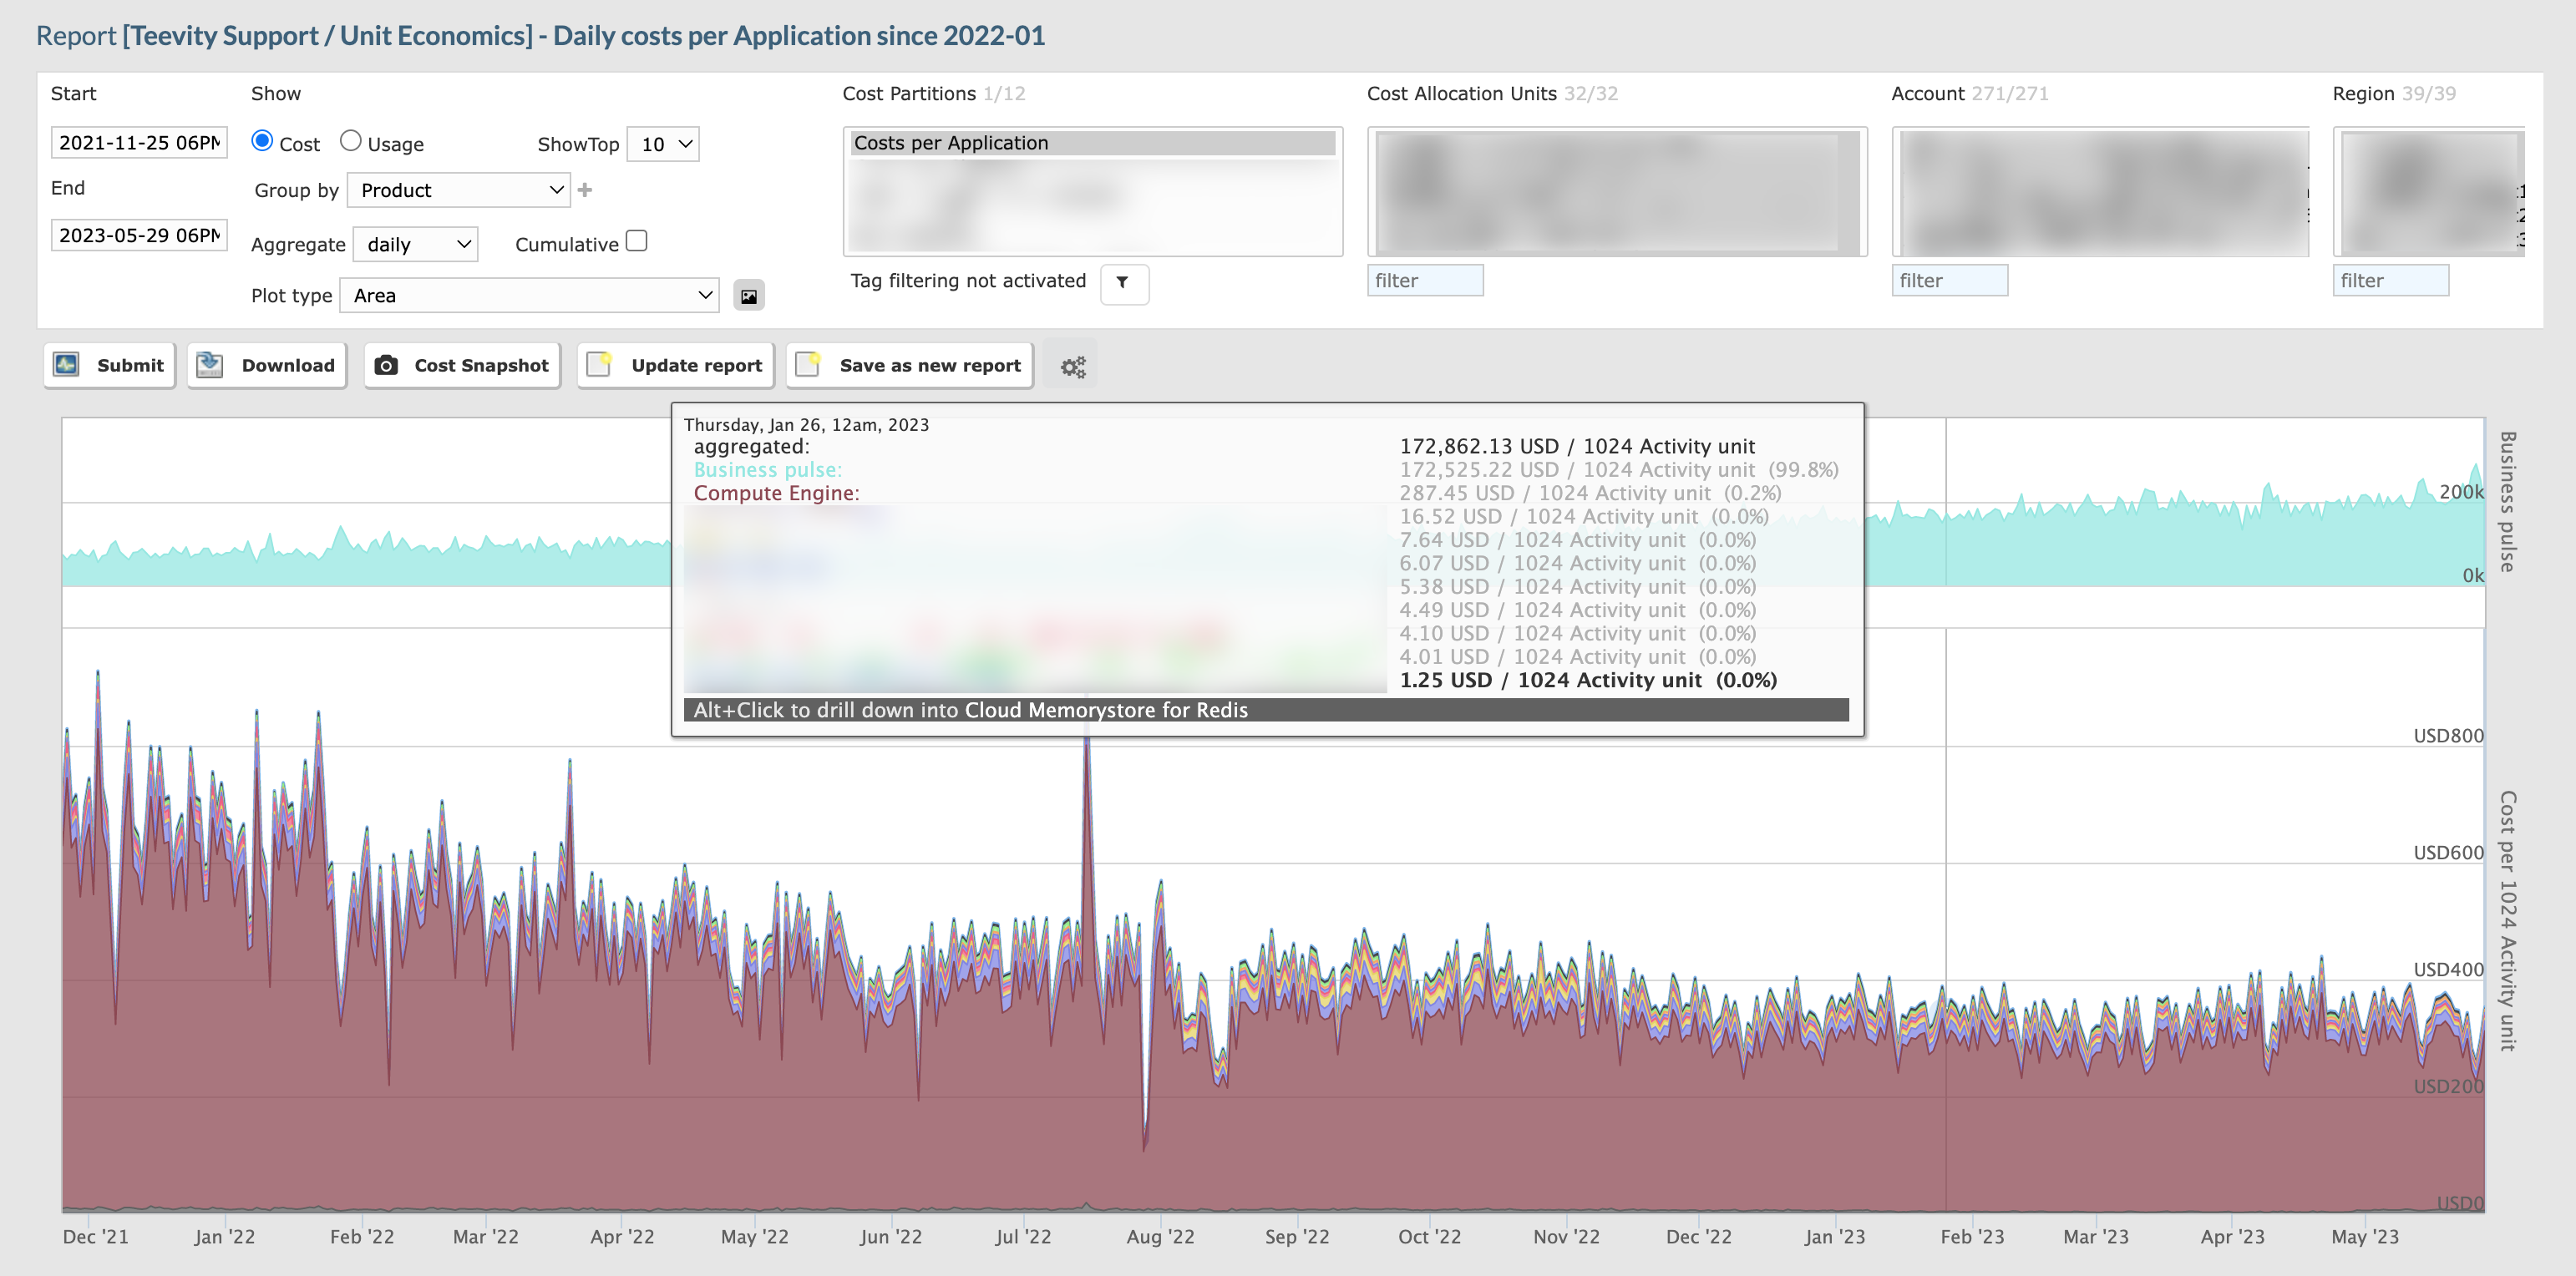 Cloud spending with business context i.e. in relative terms
For each product you can see the spend per unit (of network traffic). In this particular example we can observe a healthy trend because, even if the absolute cost of cloud spend is increasing, the relative cost by business unit is decreasing.
Try it out today and see how budget metrics can transform your FinOps journey!